Debugging Applications
There are a couple of ways to debug what is happening when things don't go well.
Note that if there are build failures when deploying a new version of an app, the currently running instance will remain up to allow you time to resolve the build failures without downtime.
Ensure proper port and host
When deploying an application, due to the dynamic nature of the hosting platform, apps are required to listen on all ports when being deployed (i.e.: 0.0.0.0). Configuration for this will depend on the programming language and framework, so it's best to check their documentation.
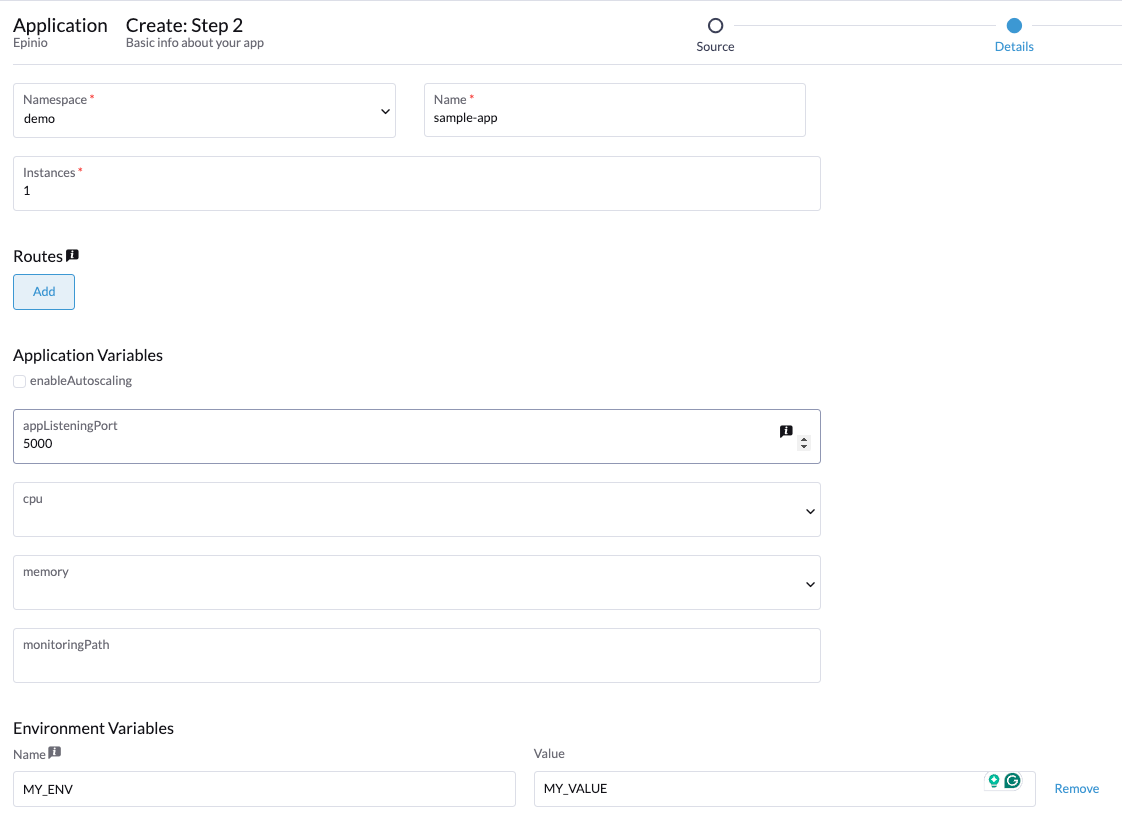
Additionally, by default, SidePro will expect apps to listen to port 8080 and forward requests to this port. You can either configure your application to listen to this port, or configure SidePro to forward requests to a customized port. You can configure this in the web UI under appListeningPort:
Restart an Applicattion
Sometimes, simply "turning it off an on again" may resolve some issues. You can do so via the sidepro CLI or Web UI:
Spawning a Shell
You can spawn a shall instance that will launch a separate container for the purposes of testing:
$ sidepro app exec sample-app

🚢  Executing a shell
Namespace: demo
Application: sample-app
heroku@rsample-app-e63233bec581b1d9effa6b6d4f0bca0985a05b55-85b58dfjk6:/workspace/source/app$
Note
Spawning a shell will launch a separate instance of your application for the purposes of shell access. It will not be the same instance as your running application.
Inspect Build Logs
Initially, the SidePro build provides access to the build logs, which can help you diagnose if the application cannot be built for any given reason.
You can also view the build logs via the CLI:
Also, be aware that your application will need to start a process and have a listening port configured in order to receive requests (the same port that it is used when configuring your application in SidePro).
Inspect Runtime Logs
If your application was built correctly but fails to start, you can access the runtime app logs via the web UI or CLI
From the CLI:
Copying logs to Clipboard
If you want to copy the runtime logs to your clipboard for use in other applications, you can pass the --clipboard option:
This will use your system's native clipboard utility.
View Monitoring
Alternatively, if you enabled Grafana in your namespace you can use it to see the same application logs and some metrics gathered from the container by going into the terminal and using the command sidepro service show monitoring. Note: the name might change depending on your configuration.
$ sidepro service show monitoring

🚢  Showing Service...

✔️  Details:
|       KEY       |                                       VALUE                                        |
|-----------------|-------------------------------------------------------|
| Name            | monitoring                                                                         |
| Created         | 2024-06-19 15:34:43 -0300 -03                                                      |
| Catalog Service | grafana-dev                                                                        |
| Version         |                                                                                    |
| Status          | deployed                                                                           |
| Used-By         |                                                                                    |
| Internal Routes | prometheus-multi-tenant-proxy.demo.svc.cluster.local |

⚠️  No settings

✔️  Credentials:
|         KEY         |                          VALUE                           |
|---------------------|----------------------------------------------|
| PROMETHEUS_PASSWORD | XXXXXXXXXXXXXXXXXXXXXXXXXXXXXXXX                         |
| authn               | users: - namespaces:                                     |
|                     |   - demo   password:                                     |
|                     | XXXXXXXXXXXXXXXXXXXXXXXXXXXX                             |
|                     | (hiding 71 additional bytes)                             |
| host                | random-string-grafana.demo.beta.sidepro.app                              |
Rolling Back an Application
Warning
Currently, the only way to roll back an application to a previous state is to create a new deployment with the previous version of the code base.
This will be improved upon in the future.


